
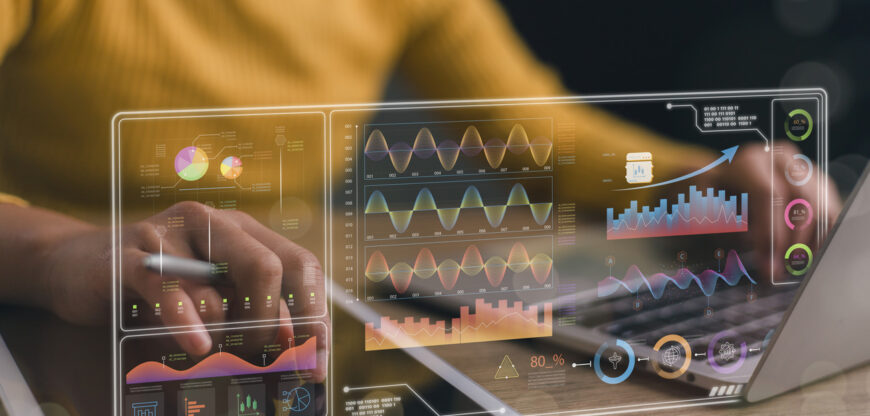
What would happen if your data had a clear voice the moment you opened the file? This can now happen through the creation of a custom dashboard for data representation using Plotly and Dash. This will ensure that the numbers are not just numbers but tell stories. To students and application-oriented learners, dashboards are not just that, but much more.
“Custom Dashboard” refers to an “interactive screen with data updating, reacting, and directing activities” because, instead of viewing static graphics on the screen, data analysis is done in real-time. By 2025, this skill is imperative in helping students who are interested in data interpretation apply data in real life.
Why dashboards are important in learning and practice
Contemporary issues require Rapid Understanding. Informational dashboards allow viewers to focus attention where it is most needed, without the need to review extensive reporting. For children, these tools provide a hands-on means of applying data acquisition capabilities. They serve as a means of applying intelligence through information for progressive thinkers.
Major benefits of working with Plotly and Dash
Well-organized and clear, interactive graphics that are legible
- Custom layouts for specific problems
- Usually associated with better
- Live updates with updates to the data
- Good for learning projects and practical applications
- Close tie between analysis and presentation
Foundations of understanding
At Plotly, the emphasis is on providing rich graphical charts such as graph charts, map charts, and table charts. Dash is utilized to integrate these charts into a functional dashboard that can be navigated using buttons, sliders, and selections made by the user.
Procedures for custom dashboard creation
Let’s define a purpose for our dashboard and determine the questions it can answer.
The purpose of a dashboard is
- Clean and ready the data so that it is precise and contextually relevant
- Select graphic symbols according to data characteristics
- Organize the layout to help the user navigate easily
- Enhance interaction by allowing users to navigate different views
Real World Applications for 2025
An educational dashboard can track the progress of learning and indicate the places where there is a need for support. A business dashboard can track the sales and performance of the business and thus help in the comparison of results over time. An environmental dashboard can help track the usage of resources and changes. A health dashboard can help in evidence-based planning.
Benefiting students through dashboard projects
Application-based students learn through building. Dashboards promote problem-solving, creative thinking, and communication. They learn to communicate results to other people, which is an important skill for employment. They will also feel confident that their applications can be used by other people.
Recent Posts
- Career Anxiety After Graduation? MCA as a Safe Yet Powerful Choice
- How to contribute to high-impact open-source projects and get noticed
- Quantum computing basics for programmers: What to learn first
- Migrating legacy applications to cloud-native architectures
- Penetration testing automation: Tools and techniques for beginners and intermediates